
Does the design peak match the maximum day?
Sizing a future water network for growth asks two questions:
How much water will be used on a single day?
What does the demand profile look like?
This piece is about the second question - the demand profile. The "how much" is covered in our blog here.
A Peak Day design profile generally assumes one standard shape for how water is used on the critical day across the network. It's been a useful assumption in the past when there was limited network data.
But the data now tells us that the real shape on the Maximum Day varies from subsystem to subsystem.
The figure below shows each subsystem's observed Maximum Day Demand profile and the design Peak Day profile for a House. These subsystems have a residential makeup of 94% to 100% so it’s fair to assume that residential demand drives these events.
You'll notice that the timing and scale of the morning and evening high demands can be different.
Getting the shape right, subsystem by subsystem, lets planners see the real profile to size future infrastructure with confidence.
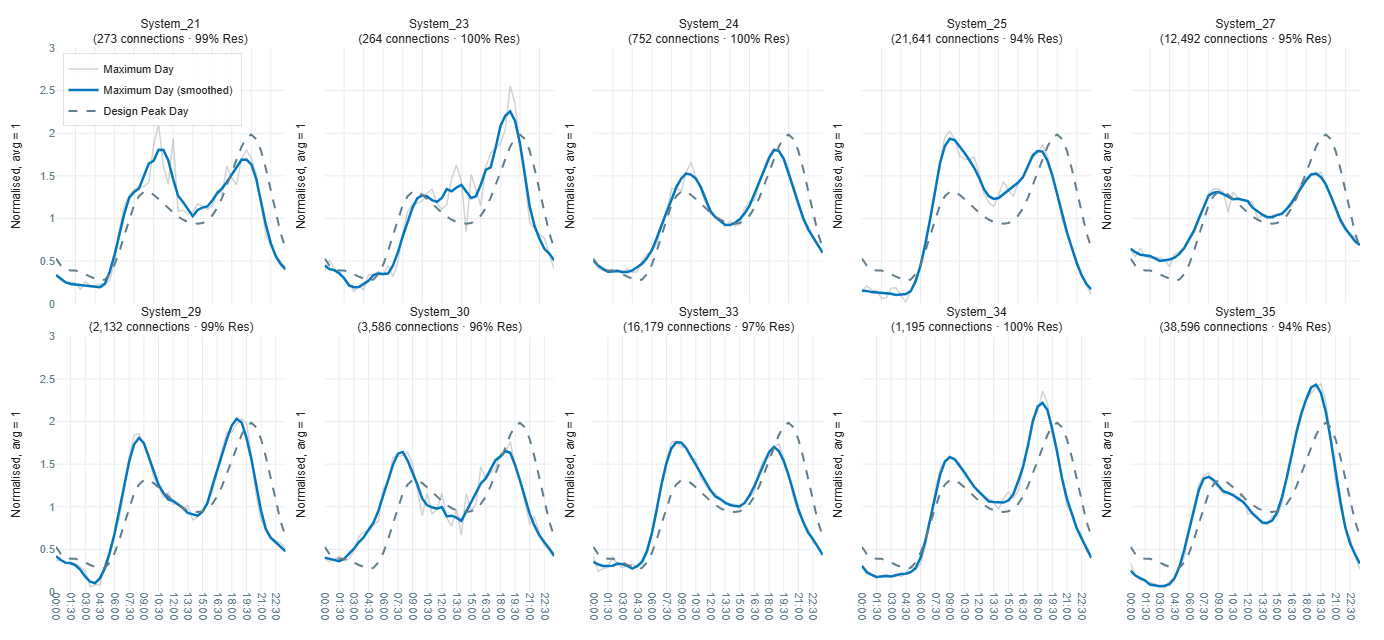
Ten residential subsystems - observed Maximum Day Demand profiles vs the single-house design Peak Day profile with connections and residential percentage