
Where’s your night flow baseline?
Water utilities lose at least USD $39 billion per year to non-revenue water, and leakage is a major component (Liemberger and Wyatt 2019).
The good news is that the operational data utilities already hold is undervalued for identifying and tracking leakage growth.
Quantified leakage growth is valuable for decisions about where to get your best return on investment with maintenance activities, via water loss ranking.
The figure below shows SensorClean's Night Flow module with baseline, year-on-year night flow growth and presented as the Combined Real Loss Index for maintenance prioritization.
CRLI normalises leakage by network size — annual loss volume against pipe length and connections — so systems of different sizes can be compared and ranked by water loss performance.
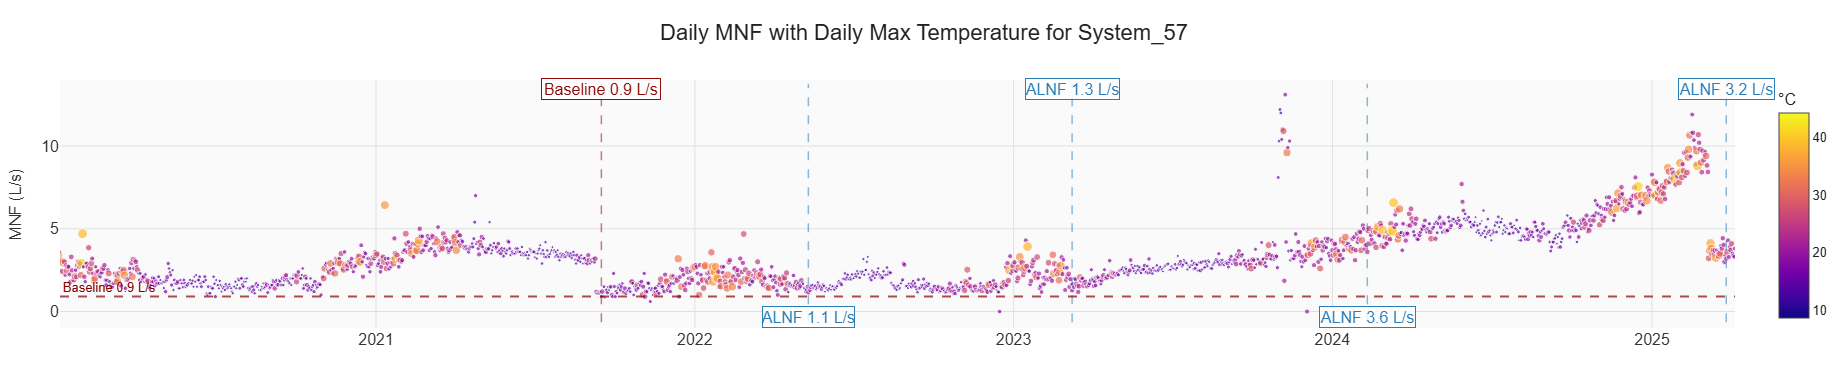
System 57 - Daily minimum night flows with Baseline and Annual Lowest Night Flow

System 57 - Summary of financial year growth in night flows with Combined Real Loss index for ranking
The baseline turns night flow from a reading into a reference point. From there, every year's growth is measurable, comparable, and ready to cost - the evidence that decides where maintenance goes next.
References
Liemberger, R. and A. Wyatt (2019). "Quantifying the global non-revenue water problem." Water Supply 19(3): 831–837.