
How often should your sensors record?
Arguably the most valuable data a SCADA system collects is the night flow, a useful proxy for leakage.
Capturing it well depends on sensor recording frequency, which deserves more thought than it often gets.
Set the frequency too low and you might still catch large pipe failures, the street-flooding events that flow and pressure thresholds pick up well.
But the valuable low-flow data disappears, and with it the best evidence for decisions about night flow growth.
On the other hand, set the frequency too high and the data returns little extra value while becoming cumbersome to store and handle.
Figure 1 shows example Subsystem 21 and the total daily observations from its two inflow sensors.
In March 2020 the count dropped from about 15,000 per day to about 1,200 per day, a reduction that suggests the high-frequency data wasn't earning its keep.
Figure 2 shows six candidates for the Annual Lowest Night Flow in 2023.
Across the off-peak period there's too little data to resolve the minimum, so the trace flattens into a straight line.
The right sensor frequency sits between the two, enough to preserve the night-flow period - without drowning in data.
As a rule of thumb, you don't want to go coarser than 1-minute time steps, which works well for night flows and picks up hydrant extraction too.
With the frequency set right, night flow growth can be quantified and tracked, so maintenance goes where it’s most economic.
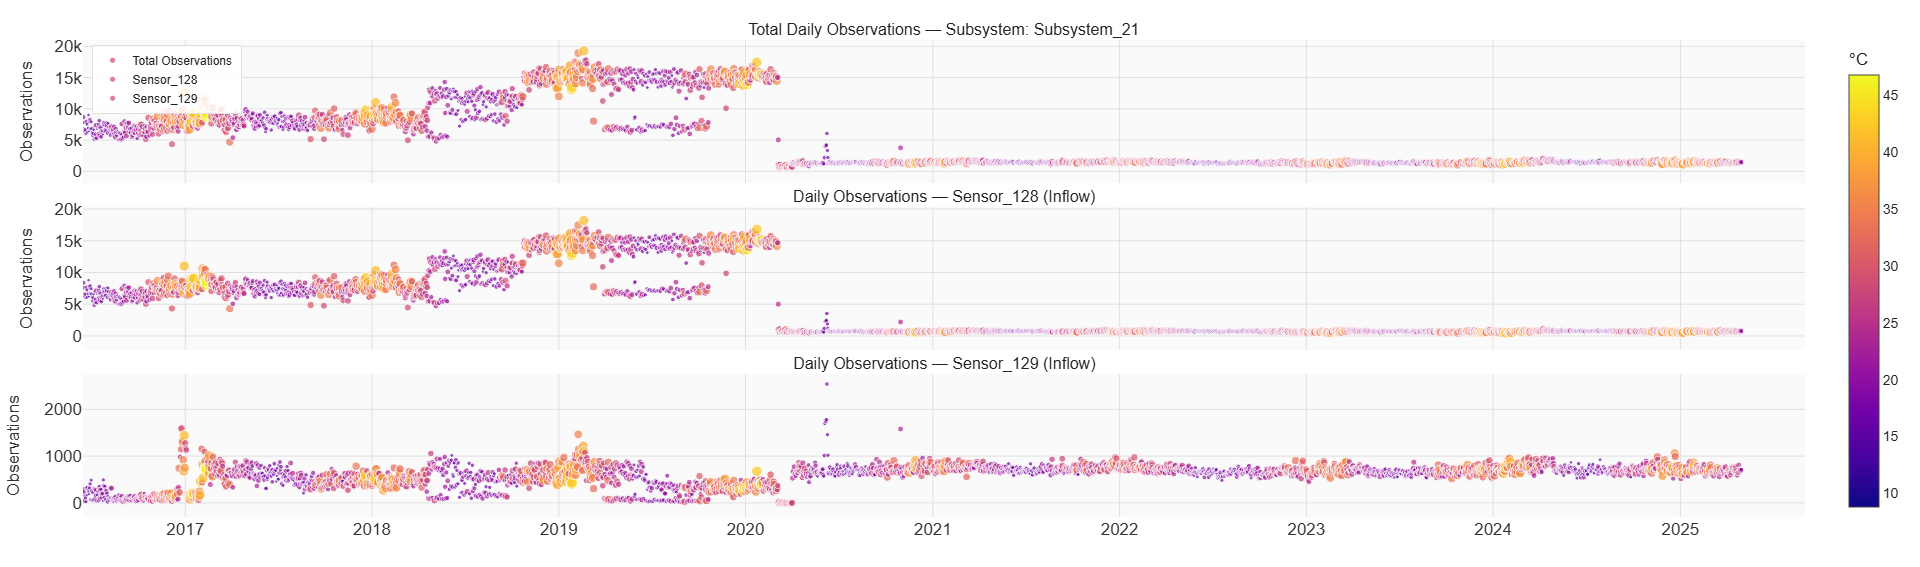
Figure 1 Example Subsystem 21 with daily sensor observations from its two inflow sensors as well as total observations. The color is linked to air temperature i.e. more sensor observations occur in the summer with higher demand periods compared with the winter period. In general, SCADA flow sensors are set to record data at fixed intervals or based on some percentage change in flow reading.
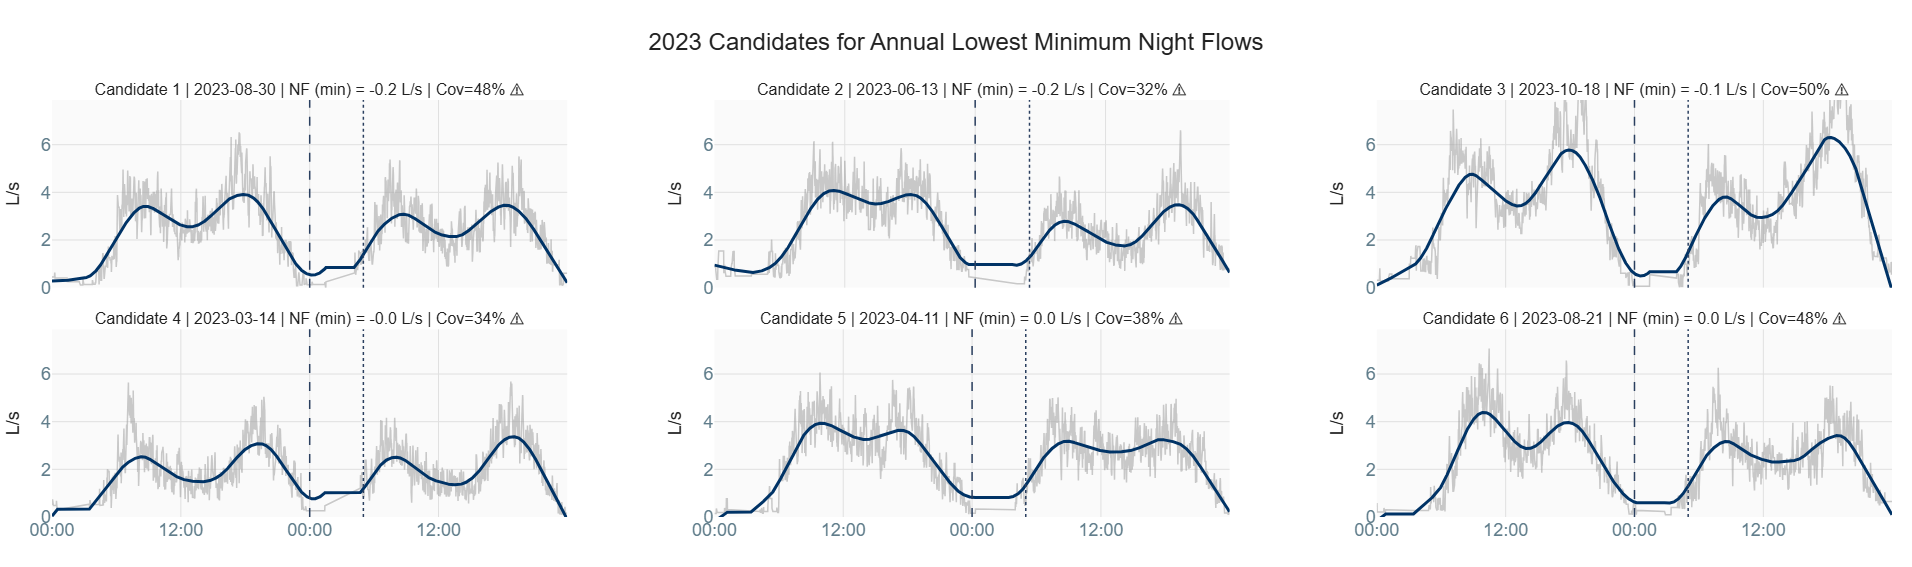
Figure 2 Example Subsystem 21 with its 2023 candidates for Annual Lowest Night Flow. The off-peak period shows a ‘straight line’ indicating a lack of data collection in this off-peak period – as confirmed in Figure 1.