Uncovering Savings Opportunities with DMA Peaking Factors
In the design of water networks ‘peaking factors’ are used for simulating design flows in hydraulic models.
In simple terms, the dimensionless peaking factor is maximum over average consumption.
Historically, utilities adopted standardized peaking factors based on their source data (treatment plant etc.) which was the most reliable source of data.
But as we enter the world of big data - and move beyond spreadsheet limitations - new possibilities arise to analyse how peaking factors vary in large systems.
What does the monitoring data tell us?
District Metered Area (DMA) data mining shows significant spatial variability i.e., peak demand events are not uniform across large water networks.
This is because of differences in the behavioural characteristics of consumers, the efficiency of water usage (technology), water restrictions, and key weather parameters (temperature and rainfall), – all of which can vary spatially.
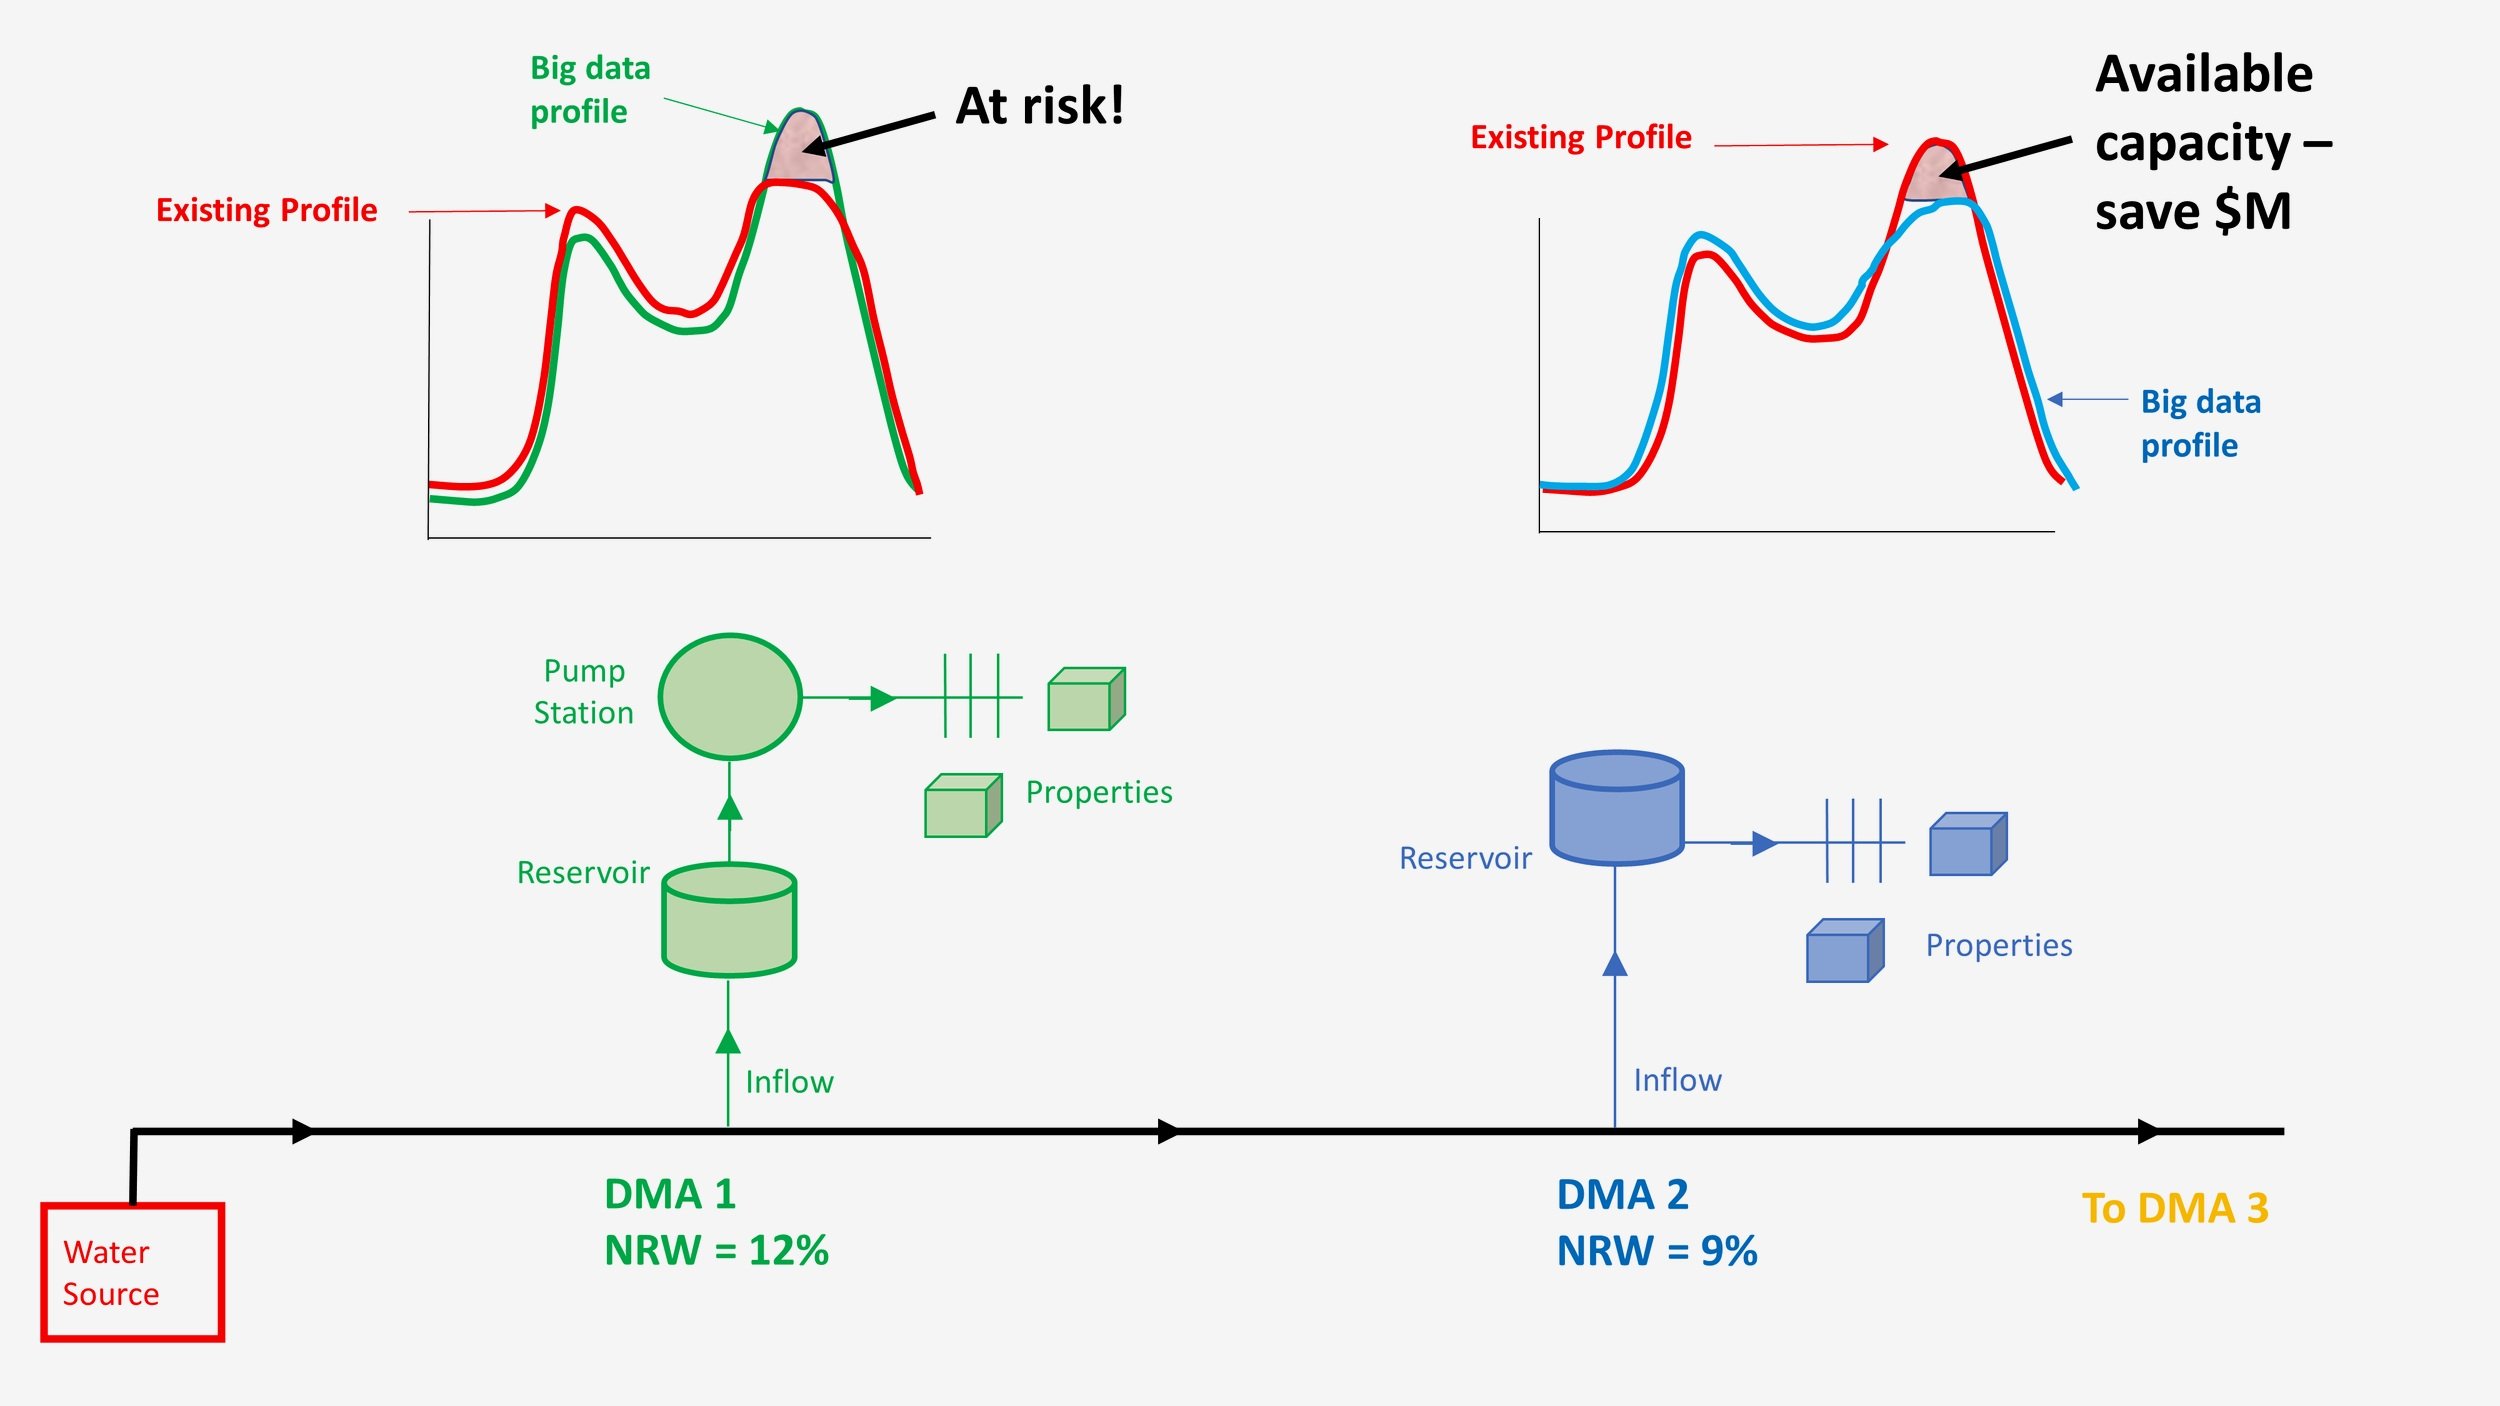
DMA peaking factor analysis can reveal opportunities to save significant sums of money through the deferral of capital works and sizing proposed infrastructure.
How are peaking factors estimated for hydraulic models?
The commonly used peak day (PD) factor is estimated using monitoring data and is the ratio of peak day consumption to the average day (AD) consumption (Surendran, Tanyimboh et al. 2005, Beal and Stewart 2013).
Similarly the peak hour (PH) factor is the hour of peak consumption on the peak day (PHPD) over the peak hourly consumption for an average day (PHAD) (Beal and Stewart 2013, Balacco, Carbonara et al. 2017).
This assumes that the peak hour occurs on the peak day – which is not always borne out by the data.
What are the implications of peaking factor selection?
The available capacity weighed against expected consumption from proposed development determines the start-time of significant infrastructure projects.
When new capacity is required, the size of pipelines is driven by the peaking factor.
Pipeline infrastructure accounts for approximately 75% of the total water network investment (Diao, Barjenbruch et al. 2010).
Peaking factor selection is therefore critical to ensure economic selection of water infrastructure (Diao, Barjenbruch et al. 2010, Bose, Neelakantan et al. 2012, Beal and Stewart 2013, Gato-Trinidad and Gan 2014).
What is the opportunity?
DMA data analysis can potentially lead to immediate savings through the deferral of capital works.
This is because existing peaking factors may not reflect actual DMA peaking factors i.e., there may be more existing capacity than otherwise thought.
Given that the source peaking factor is an average for the entire system – some peaking factors will be lower than existing numbers (extra capacity).
Conversely, some peaking factors will be higher than existing numbers. This is valuable information as it indicates that the utility is at risk of non-compliance for minimum pressure requirements.
How does SensorClean help?
SensorClean is cloud software that allows for quick DMA analysis with its automated data processing and powerful visualization.
On average SensorClean reduces time spent analysing DMA data by 90% compared with spreadsheet analysis.
Automated reporting provides insights for extreme events and peaking factors as well as non-revenue water estimates for each financial year.
In conclusion
There can be significant savings when modelling DMAs for infrastructure development using DMA data.
Knowing the spatial variability of peaking factors provides opportunities for the deferral of works and saving money on the sizing of infrastructure.
Please contact us to increase the value of your utility’s monitoring data.
References
Balacco, G., et al. (2017). "Evaluation of peak water demand factors in puglia (Southern Italy)." Water 9(2): 96.
Beal, C. D. and R. A. Stewart (2013). "Identifying residential water end uses underpinning peak day and peak hour demand." Journal of Water Resources Planning and Management 140(7): 04014008.
Bose, A., et al. (2012). "Peak factor in the design of water distribution-an analysis." International Journal of Civil Engineering and Technology 3(2): 123-129.
Diao, K., et al. (2010). "Study on the impacts of peaking factors on a water distribution system in Germany." Water Science and Technology: Water Supply 10(2): 165-172.
Gato-Trinidad, S. and K. Gan (2014). Understanding peak demand factors for water and wastewater supply systems design. Hydrology and Water Resources Symposium 2014, Engineers Australia.
Surendran, S., et al. (2005). "Peaking demand factor-based reliability analysis of water distribution systems." Advances in Engineering Software 36(11–12): 789-796.

