
Return Periods of Peaks for DMA Risk Analysis
In stormwater design, frequency curves are used to determine return periods for the design of stormwater infrastructure. For instance, a stormwater pipe may have a design return period for a 1 in 20-year rainfall event.
With a frequency curve, engineers can do risk analysis, comparing the annual savings from mitigated floods (benefits) against various levels of flood mitigation infrastructure (costs).
What about designing potable water networks?
In the design of water networks, design flows are simulated in hydraulic models using ‘peaking factors’ of undetermined recurrence interval. The peaking factor is defined as the maximum over the average consumption (link to blog).
Historically, peaking factors with return periods could not be used because there was insufficient data and inadequate big data tools to access it.
However, as utilities have been collecting monitoring data since the late 90’s it’s time to consider return periods for analysis of subnetworks i.e., District Metered Areas (DMAs).
With the return periods, a risk analysis of cost versus expected benefits can be the basis for decision-making about proposed infrastructure.
The result is more rigorous economic selection of infrastructure options.
Capturing extreme events for risk analysis
Data capture of extreme events is the cornerstone of extreme value analysis (EVA).
EVA uses multiple peak values to construct a frequency distribution and determine estimates of recurrence intervals for consumption and peaking factors.
For example, the classical EVA approach – the peak-over-threshold method - fits all peaks above a threshold to a probability distribution which is demonstrated below.

Figure 1 Example of peak over threshold separation for a DMA
Another approach is to use machine learning (ML) models with historical DMA data. ML models can use multiple simulations (Monte Carlo) to generate annual probabilities of peak consumption and peaking factors.
Knowing the recurrence interval or its inverse, annual probability of consumption exceedance allows engineers to estimate expected benefits i.e., the reduction in non-compliance events.
Then a risk analysis can be undertaken for the life of the project and the costs versus expected benefits can be assessed.
DMA data mining is the first step
You can think of your data’s extreme events as data that can save communities a lot of money. So historical extreme events in all DMAs need to be carefully scrutinized.
It’s crucially important that all true peak events be identified and not accidentally discarded, because of the significant implications on the probability distribution of these events or peaking factor estimates.
It’s equally important that false peaks due to data errors are identified and discarded.
Comparison of peaks in DMA’s will reveal the spatial variability of peak flows i.e., how extreme events vary across large areas.
This offers immediate improvements of capacity assessments and sizing of new infrastructure (see blog).
How to easily scrutinize the data (and not lose any peaks)
SensorClean is cloud software that allows for quick DMA data mining (10 times faster than spreadsheets). Its peak flow use-case presents visuals of extreme events with key data quality information.
The figure below shows a DMA’s 10 highest ranked consumption days with the peak hour for that day shown in blue.
The pink data shown below is infilling using the 1-minute monthly mean separated for weekdays and weekends with public holidays removed. SensorClean infills here to avoid losing this peak event.
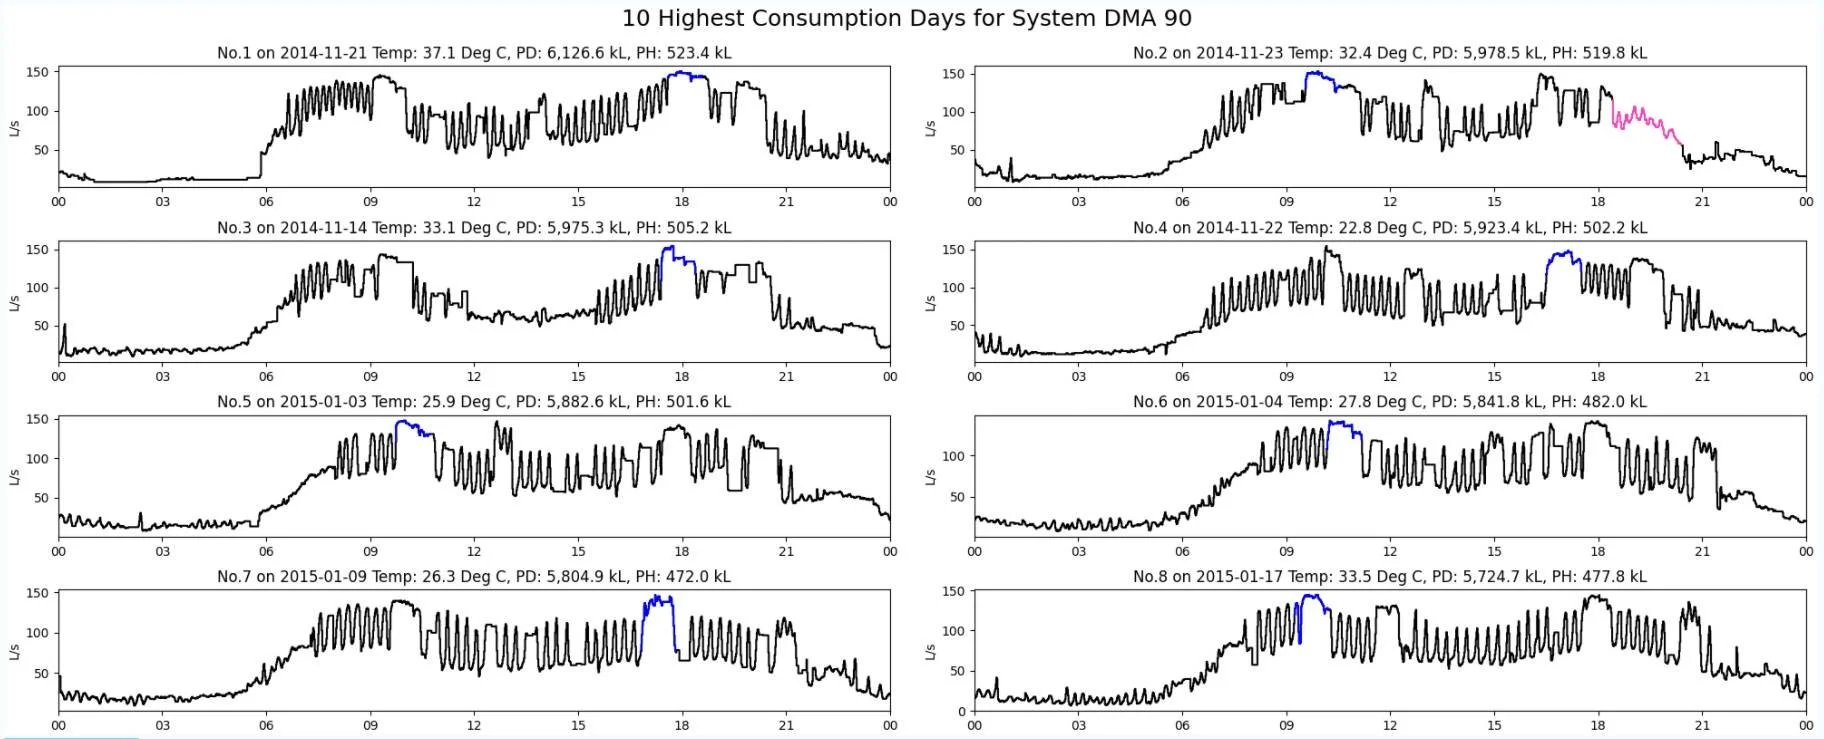
Figure 2 Peak consumption days from SensorClean
In conclusion
With modern big data tools, economic selection of infrastructure using recurrence intervals for risk analysis will become the norm.
It’s time to make sure the data we have now and what we will collect is fit for purpose.
Please contact us to increase the value of your utility’s monitoring data.