
How Utility Big Data Can Reduce Risk and Save Capex

Water network infrastructure is designed to satisfy summer peak demand events.
Peak flow estimates are therefore strongly linked to capital expenditure for pipelines, pump stations etc.
However, in many cases, existing peak flow design numbers are based on demand events from decades ago.
Fusing utility big data to tease-out peak flows, offers managers an opportunity to reduce risk and save capital expenditure.
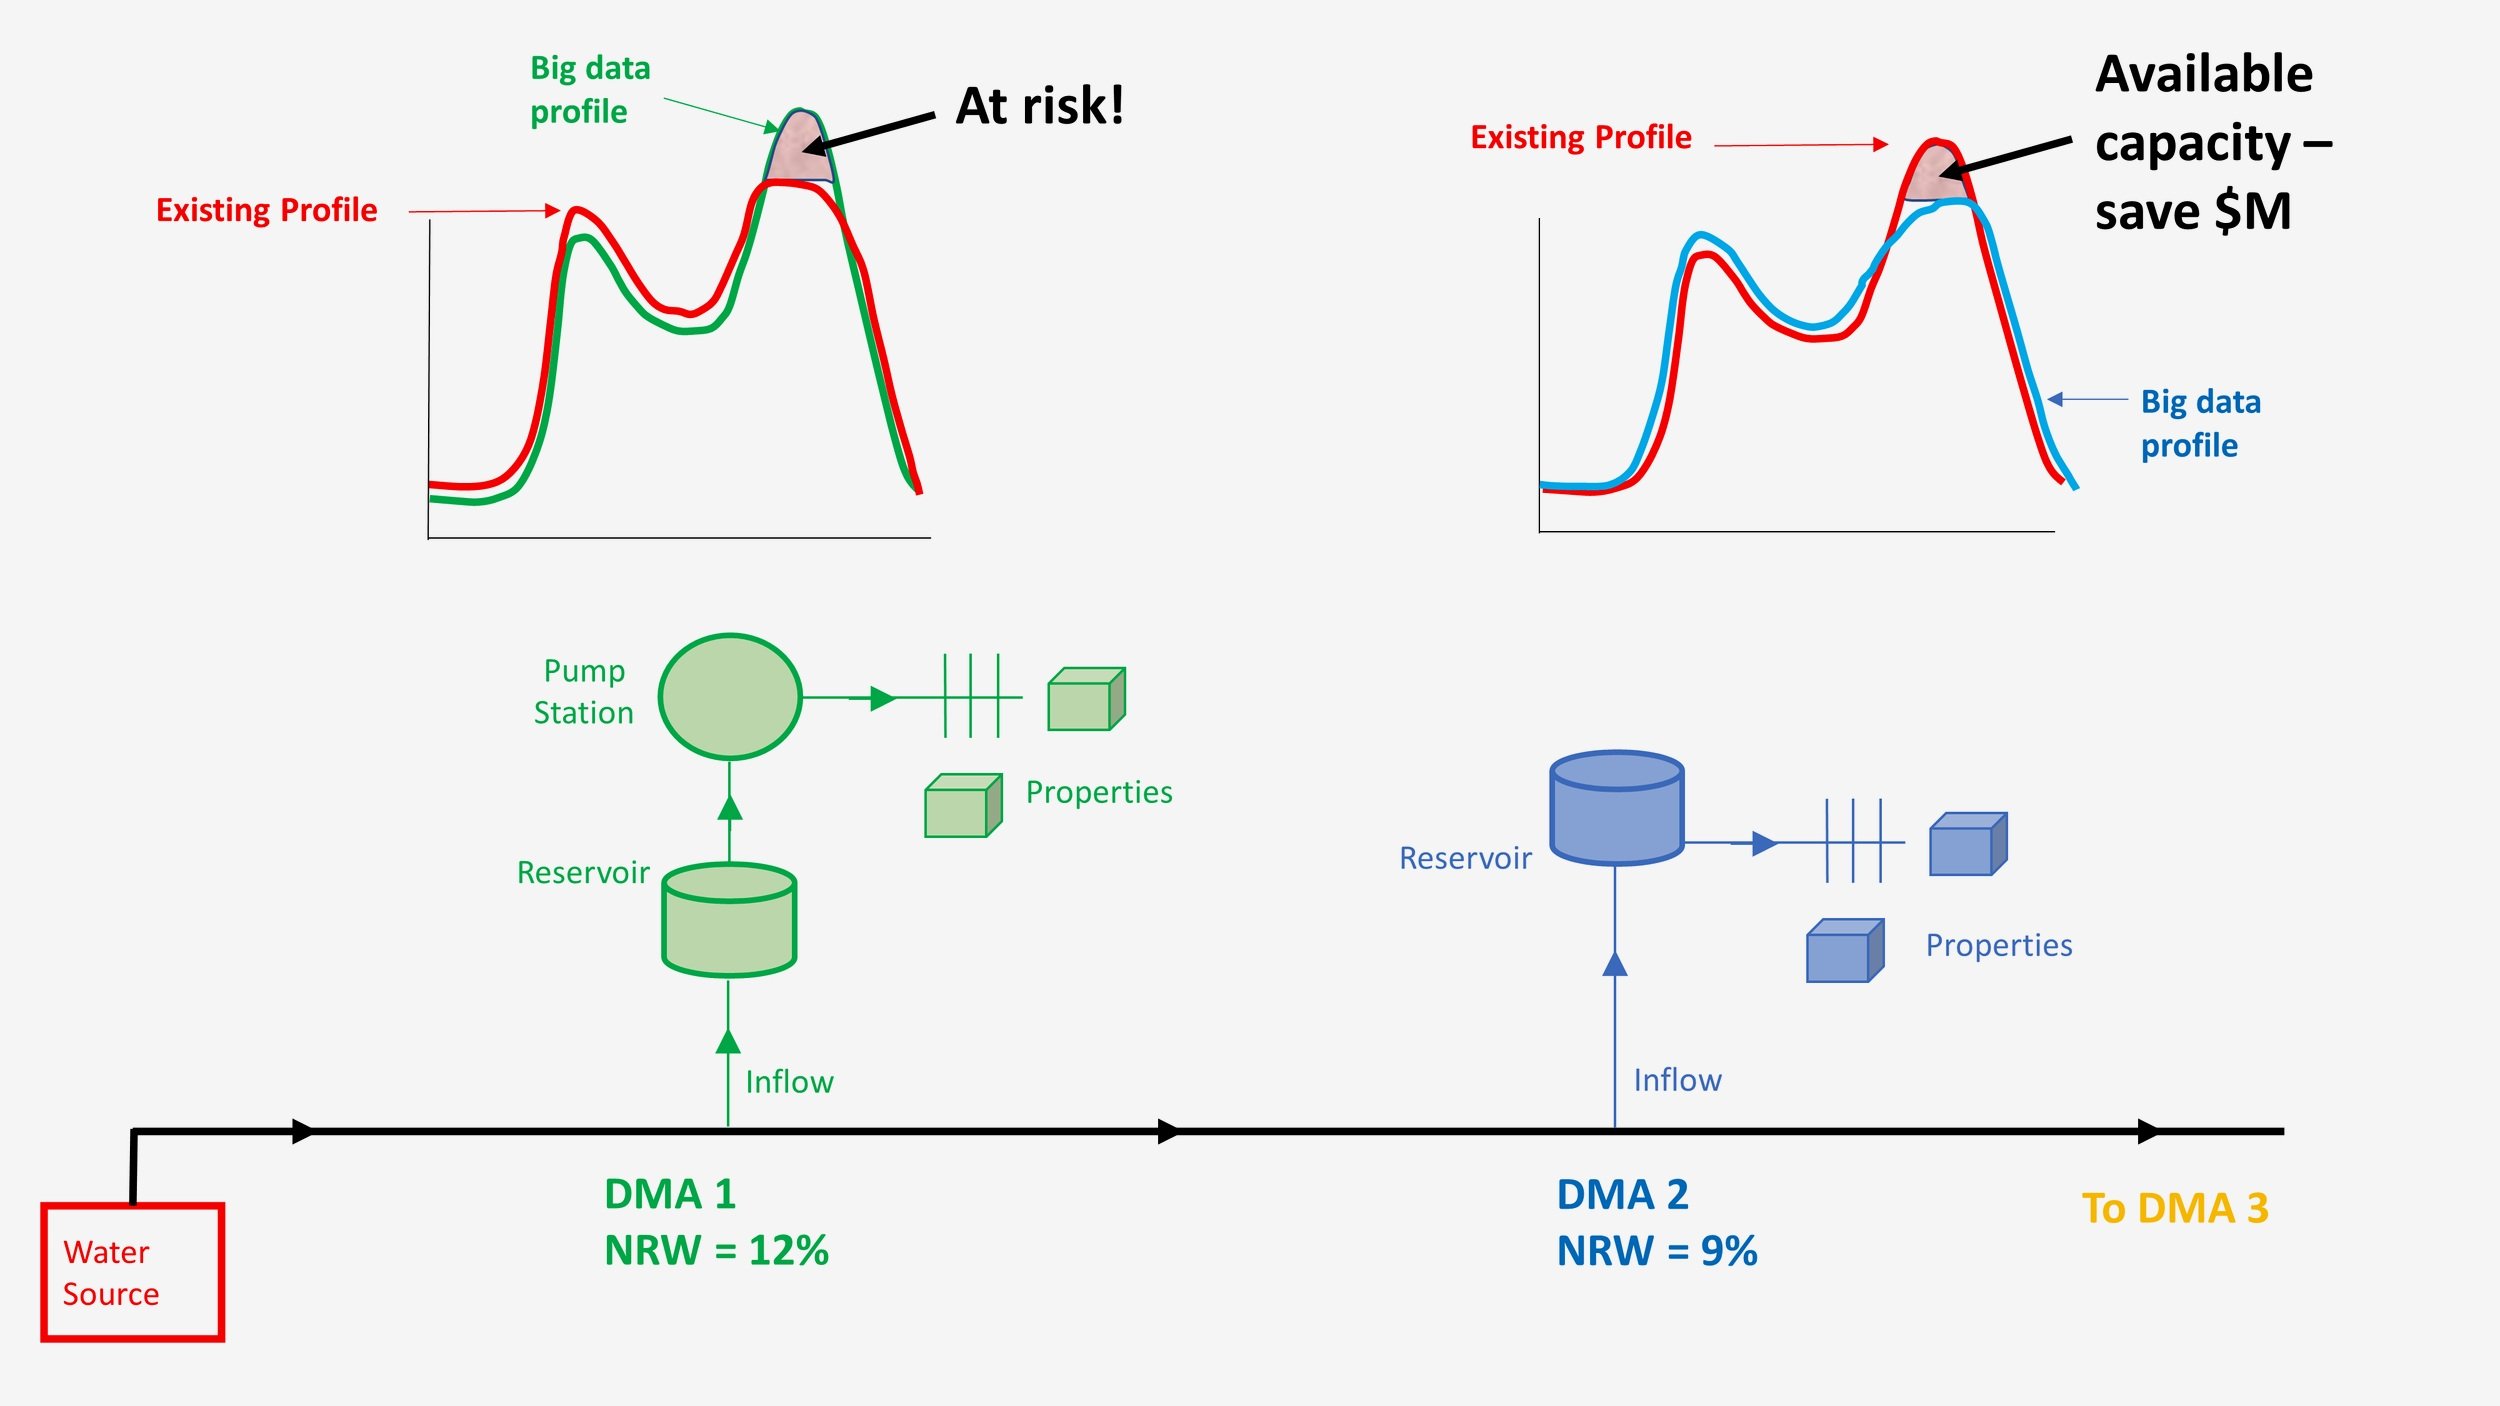
Opportunity
Existing peak demands are an average of the entire (large) system as they’re based on the source data e.g., treatment plant.
Spatial data mining reveals variability and some existing peak flows are:
too high (opportunity to save on capital); and
some are too low (risk of pressure non-compliance).
Demand categories and a 3-month time step
Demand Categories refer to different types of land use e.g., residential, commercial etc.
Their associated flows are simulated in hydraulic models – to understand network performance – under peak demand scenarios.
The problem with updating peak demand numbers is that billing data has a 3-month time step and therefore the peaks are unknown.
However, by organizing billing and network data, and using data science, we can move beyond this problem to estimate more recent peak flows for each demand category.
Saving millions of dollars on capex
The start time of capital projects is determined by available capacity – weighed against proposed demand from new development.
Adjustments to peak flows linked to available capacity and NPV analyses, can save millions of dollars.
For example, deferring a project by 5 years at the Australian July 22 discount rate (3.1%) saves approximately 14%.
This is a $14M saving for a $100M dollar project, or a $1.4M saving for a $10M project.
More economic selection of infrastructure
The table below summarises the estimated cost of a 10km ductile iron cement lined (DICL) pipeline. Two example scenarios are shown with different pipeline diameters, and their associated costs in 2022 dollars.
Scenario 1 offers the hypothetical status quo 450mm diameter pipeline which is sized from decades past peak flows.
Scenario 2 presents the cost of a ‘next size down’ pipeline which has a diameter of 375mm.
The cost savings between the two scenarios is $1.5M dollars in 2022 dollars.
The rates used in Table 1 are from the NSW Reference Rates Manual (Government 2014) and are converted from 2014 dollars to 2022 dollars using an average inflation rate of 2.54% per year.

Example of different DICL pipeline costs linked to peak flows
The example above does not include savings from potential pump stations and tanks and is therefore considered conservative.
Reducing risk
Spatial data mining has revealed data surprises that challenge hydraulic modelling assumptions.
For example, the peak day occurs on day 3 of the peak week, and the peak hour always occurs on the peak day.
Presenting big data peak flows is an opportunity to reduce the probability of non-compliance events occurring.
In doing this, utilities can avoid potential fines from their regulator.
What’s next?
Fusing utility big data sets offers utility managers a powerful decision-support tool for new water infrastructure.
These data sets allow decision-makers to reduce utility risk and save on capital expenditure.
Please contact us to increase the value of your data.
References
Government, NSW. (2014). NSW Reference Rates Manual : valuation of water supply, sewerage and stormwater assets. Department of Primary Industries, Office of Water.